The Most Overpriced Neighborhoods in LA and Orange County
By Sean Hingco, Founder, Saktoo
We scored 285 LA and Orange County neighborhoods on walkability, amenities, environment, commute and space, then checked what each one charges. Half the rent has nothing to do with any of it.
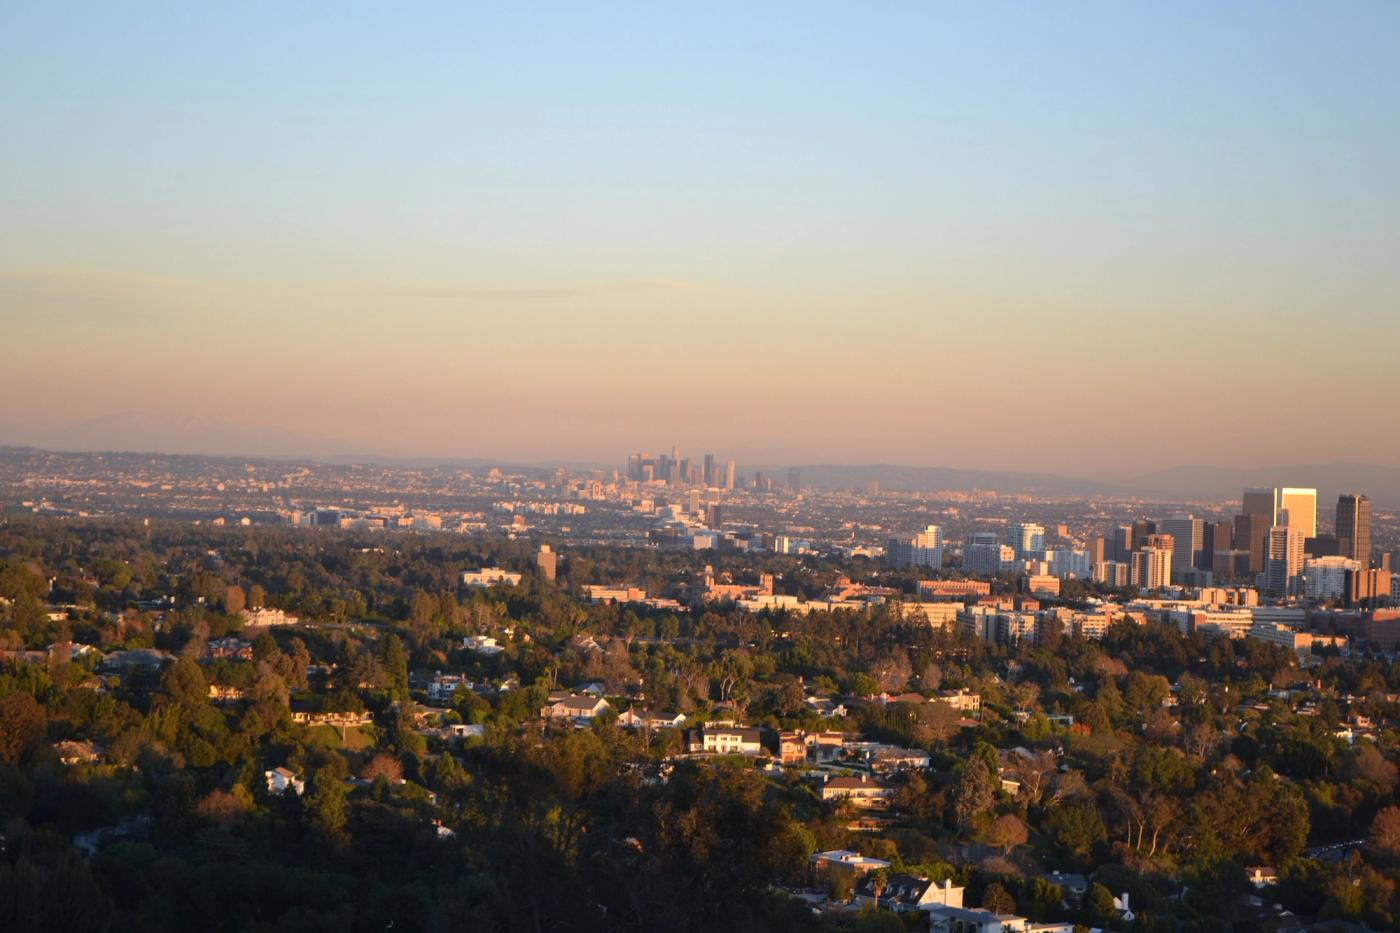
Two neighborhoods, four kilometres apart, both in Irvine.
One is Turtle Rock. The other is Woodbridge. Same city, same freeway, same weather, same trip to the same grocery stores. Turtle Rock's median rent runs $577 higher, and its homes sell for 77% more.
So what does that $577 buy?
Saktoo scores neighborhoods on five things that can be measured from public data: walkability and transit, everyday amenities, air and green space, typical commute, and space per home. All five run across 285 LA and Orange County neighborhoods. If you know only those five numbers, how well can you guess the rent?
About half as well as you would hope, and the miss is not random. The five measures explain 54% of what neighborhoods charge, leaving 46% that none of them can account for.
Turtle Rock isn't even the biggest gap. That belongs to Century City, $1,108 a month above what its own measurements predict. Turtle Rock is second, at $884, a bigger number than the $577 it actually charges over Woodbridge, because this is a different question: not what one neighbor charges another, but how much of a neighborhood's own rent its walkability, amenities, environment, commute and space cannot explain. Neither is a bad neighborhood. Both score well: Century City sits in the 59th percentile overall, Turtle Rock the 59th too. So does Culver City, at $777 a month less.
Where the number comes from
Every premium in that list is one subtraction. Each neighborhood gets a predicted rent built from a regional baseline plus its five scores, and the premium is whatever the actual rent does on top of that.
Real places behind three of Century City's five scores. Commute and space work differently, straight from Census statistics rather than points on a map.
Century City's commute score of 0.98 is nearly the best in the region and adds $426. Its space score of 0.11 adds $114, because it is mostly small units. The five together predict $2,242 against the $3,350 it charges.
Weigh it your own way
Our five measures are a guess at what people want. Yours will be different, so use yours.
Weight everything equally and going from the worst-scoring neighborhood in the region to the best is worth $3,491 a month.
Now turn everything off except walkability and transit. The line does not flatten. It inverts, to minus $992. Across LA and Orange County, the more walkable and better-connected a neighborhood is, the less it costs.
That result holds without any weighting at all. Rent's raw correlation with our location measure is minus 0.24.
Weighted equally alongside the other four, walkability and transit are worth $45 a month across their entire range, from the least connected neighborhood in the region to the most. Space is worth $1,075 across its range, clean air and tree cover $887. Square footage is worth 24 times what walkability is.
Every comparison from here on runs the same five measures against each other. Try it yourself first, on any two neighborhoods, before you see the five ahead.
Five premiums, five answers
Each card below also lists what protects a renter there from a steep increase. California's AB 1482 is the floor everywhere: it caps annual increases on most buildings at least 15 years old. A city can layer its own ordinance on top of that, usually a lower cap and broader eviction rules. Los Angeles's own ordinance, the oldest and strongest in the region, applies to buildings first occupied before October 1978. A card marked "AB 1482 only" has just the state floor. Anything else means the tenant has more.
Turtle Rock and Woodbridge share a city, a climate and a commute. Woodbridge scores 60th percentile to Turtle Rock's 59th. Rent runs at least 17% lower and the typical home costs 44% less, $897,000 against $1,591,000.
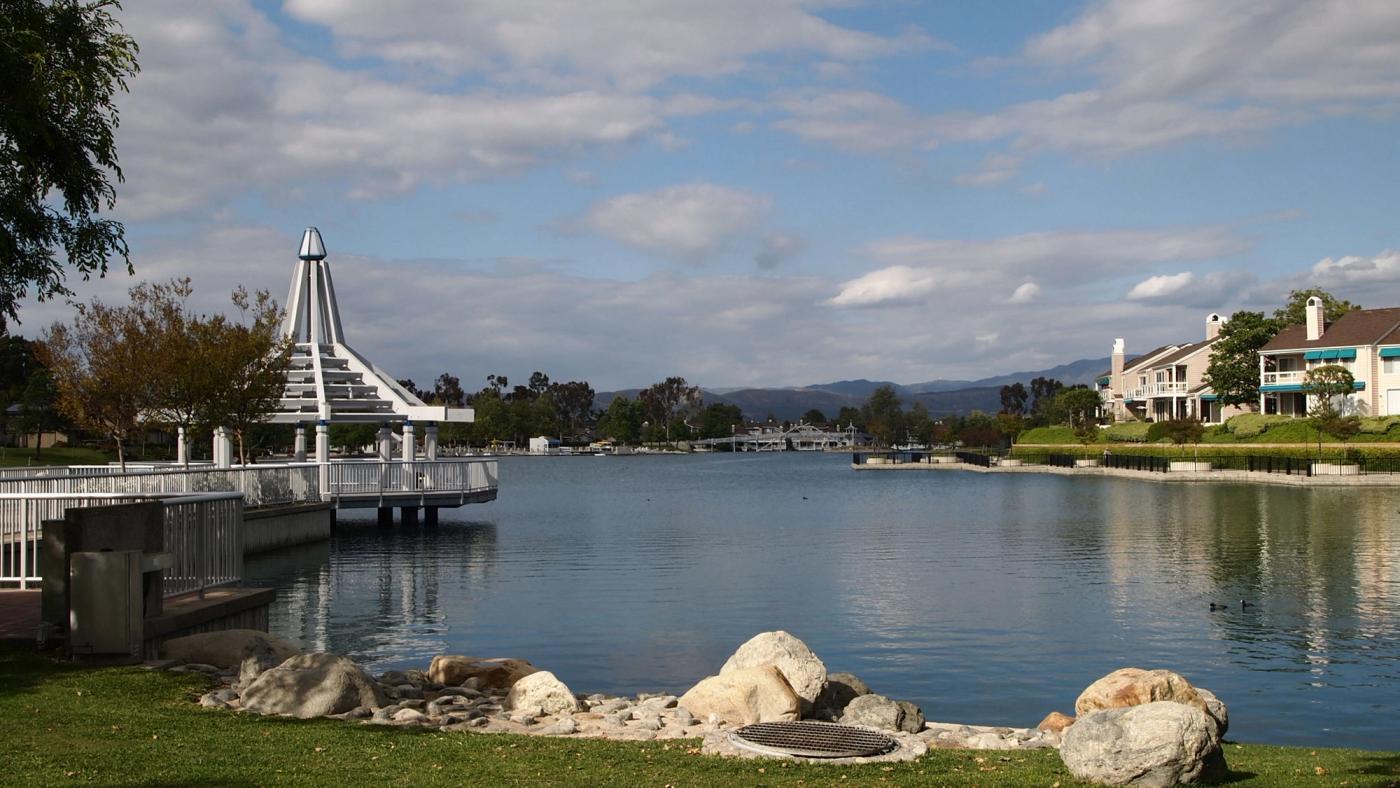
Rancho Palos Verdes and Harbor City add a second axis: tenant protection. Harbor City is inside the City of Los Angeles, so most of its pre-October-1978 buildings cap annual increases for sitting tenants. Rancho Palos Verdes has no local ordinance, which leaves California's statewide cap as the only protection. Two neighborhoods seven kilometres apart, and the cheaper one is also the harder one to be priced out of.
Six of the alternatives in this analysis carry that advantage.
What the gap tracks
Across all 285 neighborhoods, rent correlates with our amenity score at plus 0.62. With median household income, it correlates at plus 0.83.
Rent tracks who lives in a neighborhood more tightly than what is in it.
This piece stops at comparisons for that reason. Among the 125 nearby pairs that qualify, following the cheaper option moves you, at the median, to a neighborhood with $31,581 less household income and a 20.8 point higher Hispanic share. Requiring the cheaper neighborhood to also beat the expensive one on home prices or amenities widens that gap, not narrows it: 32.2 points, in the same direction 95% of the time.
None of our five measures can see any of that. The scoring never touches income, race, schools or crime, and adding them would not change a single premium in the ranking above. Every premium in this piece comes out of prices alone.
How this was measured
Rent and home values are American Community Survey five-year block-group medians, aggregated to neighborhoods by population. Walkability, street connectivity and transit come from the EPA Smart Location Database. Air quality and traffic burden come from CalEnviroScreen 4.0. Amenity density comes from our own points-of-interest grid.
Two numbers to treat as floors. The Census caps its rent measure at $3,500, which affects 366 of the block groups here and every one of them sits on the expensive side of a comparison, so real gaps are wider than the ones shown. And the model underweights distance, which is why its best-value tail fills up with Antelope Valley.
A neighborhood needs at least 4 block groups and 5,000 residents to be named, which excludes 46 of the 285.
Sean Hingco, Founder, Saktoo
Sean Hingco built and maintains Saktoo, which scores 7,644 neighborhoods across Los Angeles and Orange County on census, school, crime and environmental data. He writes the methodology behind every ranking here and publishes the underlying figures so they can be checked.
More about the person behind Saktoo →