Best Cities in Orange County for Families
By Sean Hingco, Founder, Saktoo
Rancho Santa Margarita, Irvine, Yorba Linda, Laguna Niguel, Fountain Valley. Thirty cities on eighteen measures, including what a home costs and whether the city is building any.
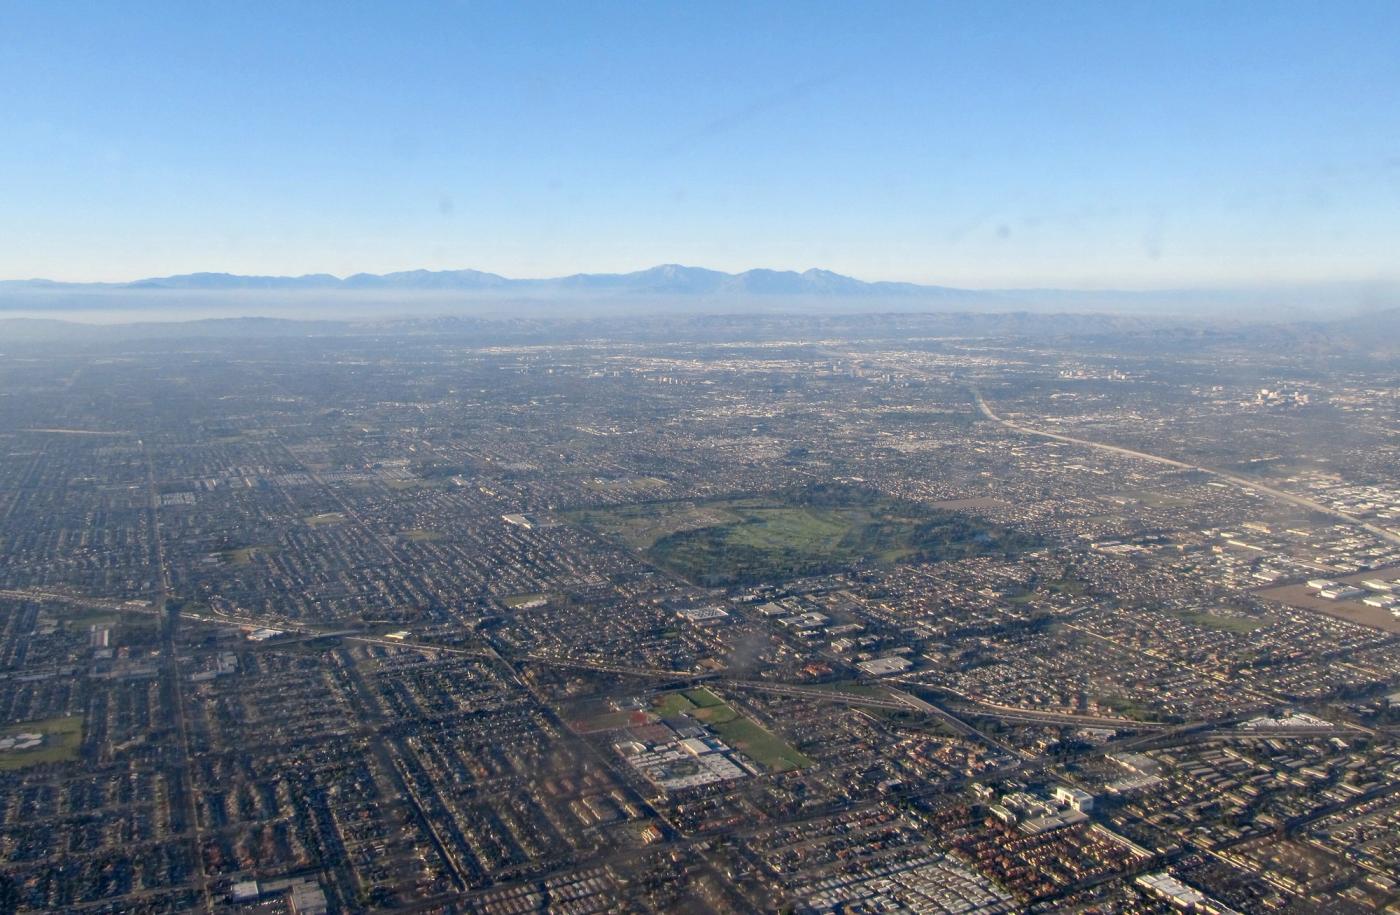
Rancho Santa Margarita comes first. Then Irvine, Yorba Linda, Laguna Niguel and Fountain Valley.
This ranks all thirty incorporated Orange County cities with at least 20,000 residents on eighteen measures. Twelve of them count something directly: childcare places, walking distance to school, park acres, tree cover, air, crime, test scores, how connected the streets are, what it costs to buy in, whether the city is building. Three are rough stand-ins for things nobody counts. The rest are context.
The 10 Best Cities in Orange County for Families
Saktoo, 2026 · 30 cities scored on 18 measures
Journalists and publishers: this map is free to embed or reproduce with attribution. The underlying table is downloadable below.
Two lists, and why they differ
Start with the four things Orange County family listicles almost always rank on: test scores, violent crime, how new the houses are, and how expensive they are. Score the thirty cities on those alone and you get one list. Irvine first, then Yorba Linda, Rancho Santa Margarita, Aliso Viejo, Laguna Niguel.
The big national rankings are broader than that. WalletHub scores 182 cities on 45 metrics across five equal categories, including parkland per capita, playgrounds, walkability, childcare and air quality. Niche weights school quality, safety, affordability and family amenities. But a national ranking carries a lot of county-level data, and inside Orange County that data is the same number for all thirty cities. It cannot separate Stanton from Newport Beach on air quality, because it does not try to.
So: fourteen more measures, all of them varying between these cities, and the same thirty scored again. Seven of the top ten survive. Three do not.
Santa Ana moves from 29th to 11th. San Clemente falls from 7th to 24th. Newport Beach leaves the top ten. Those three moves account for most of the difference between the two lists, and each one traces to something specific, which the map further down shows.
The ten best cities in Orange County for families
1. Rancho Santa Margarita
The lowest crime in the county, the fewest stretched households, and almost no new housing. 0.54 violent offences per 1,000, first of thirty, and reported offences are down 17% since 2013. Diesel burden in the 20th percentile statewide, 36% of households have children, and it has the fewest homeowners past a third of their income of any city here, three in ten, despite carrying Mello-Roos and full HOA dues. At 8.1 times a county-median income it is also the most attainable city in this top ten. Against that: five homes permitted against a state target of 680, and a street network at 14 walkable intersections per square mile.
2. Irvine
The best adult outcomes in the county, and a city most of its own workforce cannot live in. Children raised in Irvine reach the 83rd percentile of the income distribution, tied for the best here, and it has permitted 6,610 homes, more than any other city. Violent crime is 0.84 per 1,000, third lowest, and 64% of homes are within a ten-minute walk of a school despite Irvine being the largest city. What holds it back is arithmetic: Irvine holds 181,829 jobs against 51,583 homes, three and a half jobs for every housing unit, while a home costs 9.9 times what a typical Orange County family earns. Most of the people who work there commute in because they cannot live there. Reported offences are also up 39% since 2013, the steepest rise of the thirty.
3. Yorba Linda
The most childcare, the biggest houses, and almost no crime. Nothing within walking distance. 0.71 licensed childcare slots per child under six, second highest of the thirty. 84% of homes have three or more bedrooms, the highest share in the county. Violent crime is 0.65 per 1,000, second lowest, and flat over a decade. The trade is stark: Yorba Linda has the fewest everyday destinations near its homes of any city in Orange County, only 53% of homes are within a ten-minute walk of a school, and it has permitted 216 homes against a state target of 2,415.
4. Laguna Niguel
The best childcare in the county, and the least connected streets in it. 0.80 slots per child under six, first of thirty, with 6.1 park acres per 1,000 residents and adults who grew up here reaching the 78th percentile. It has permitted 29% of its housing target, among the better records here. Two things pull against it: 6.5 walkable intersections per square mile is the lowest figure of the thirty, and only 25% of households have children.
5. Fountain Valley
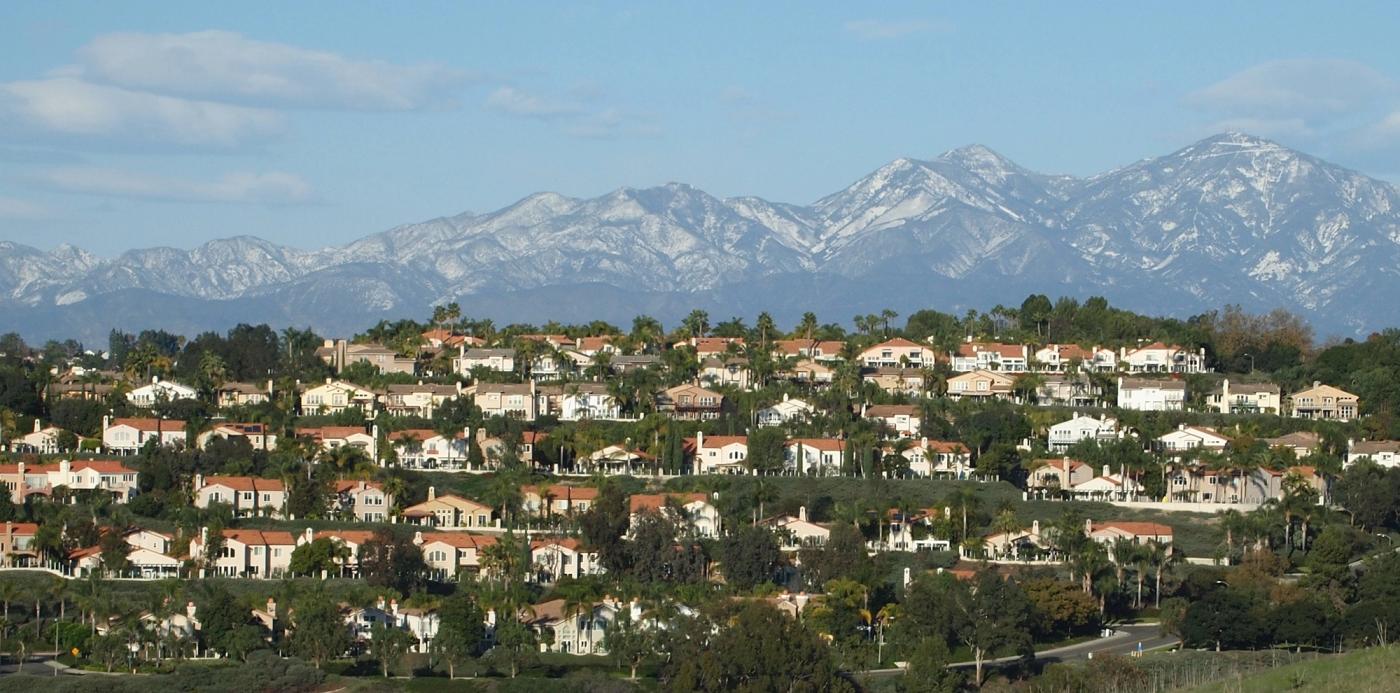
The only city in Orange County with a normal amount of park space, and short walks to school. 14.0 park acres per 1,000 residents against a national benchmark of 10; no other city here clears it and the median city has 2.8. 82% of homes are within a ten-minute walk of a campus, crime is down 7%, and jobs and homes are close to balanced at 1.7 jobs per housing unit. Its weaknesses are shade at 3.6% canopy and a street grid at 13 walkable intersections per square mile.
6. Cypress
More children per household than anywhere else in the top ten, and the most attainable homes in it. 38% of households have children, second highest of the thirty, so there are peers on the street. 78% of homes are within a ten-minute walk of a school and 74% have three or more bedrooms. At 7.7 times a county-median income it is tied for the most attainable city here, and three homeowners in ten are stretched. What it lacks is greenery: 2.6% tree canopy, the lowest of the thirty.
7. Lake Forest
Among the most shaded cities in the county, with quiet roads and a real building record. 13.2% tree canopy, fourth highest of the thirty and more than five times the county's weakest. Violent crime is 1.33 per 1,000 and traffic exposure sits in the 48th percentile. It has permitted 788 homes, 24% of its target, one of the better records in this ten, and homes run 7.8 times a county-median income. The school run is long, with 55% of homes inside a ten-minute walk.
8. Tustin
The most to walk to, the shortest commutes, and the best school coverage in the top ten. 85% of homes are within a ten-minute walk of a school, the best coverage here, and the average home has 46 everyday destinations nearby, second most in the county. Only 4.9% of workers commute over an hour, second lowest of the thirty. Childcare is strong at 0.54, 35% of households have children, and homes run 7.9 times a county-median income. The trade is schools: 47% of students meet standard.
9. Aliso Viejo
Low crime and good park land, undercut by childcare and by building nothing. 1.09 violent offences per 1,000, 5.0 park acres per 1,000 residents, adult outcomes at the 71st percentile, and at 7.7 times a county-median income it is tied for the most attainable city in this ten. But 0.30 childcare slots per child is below the shortage threshold of 0.333, which for a household with a toddler is the binding constraint, and it has permitted three homes against a state target of 1,195.
10. Mission Viejo
Consistent rather than exceptional, and nothing in it is bad. 1.14 violent offences per 1,000, 0.45 childcare slots per child, 72nd percentile adult outcomes, 72% of homes with three or more bedrooms. It leads on nothing and fails on nothing, which is a real answer for a family without one overriding priority. The exceptions are the street network at 8 walkable intersections per square mile, second lowest of the thirty, and 157 homes permitted against a target of 2,217.
Four cities the extra measures see differently
Two that climbed, two that fell. Each city gets a wide shot to place it in the county, then a close one showing the measure that moved it.
What money buys a family in Orange County
Whether a city is open to the next family
California assigns every city a share of the housing the region needs and tracks building permits against it. All thirty cities here are working to the same clock, October 2021 to October 2029, so the figures compare directly.
A city that permits nothing is closed to the next family, including your own children when they are grown. No other measure here is as free of income: the correlation is -0.03.
| Homes permitted | Share of its state target | |
|---|---|---|
| Santa Ana | 4,023 | 128% |
| Laguna Beach | 404 | 103% |
| Laguna Niguel | 355 | 29% |
| Irvine | 6,610 | 28% |
| Fountain Valley | 670 | 14% |
| Yorba Linda | 216 | 9% |
| Newport Beach | 301 | 6% |
| Rancho Santa Margarita | 5 | 1% |
| Aliso Viejo | 3 | 0% |
Who can actually move in
A city priced beyond the region's own families is best for the families who already got in. So the ranking counts what a home costs relative to what a typical Orange County household earns, and it counts it as a cost rather than as a mark of quality.
Irvine is the clearest case. It holds 181,829 jobs against 51,583 homes, three and a half jobs for every housing unit, the second-highest ratio in the county. A home there costs 9.9 times what a typical Orange County family earns. Both things are true at once, and together they mean most of the people who work in Irvine commute in from somewhere else because they cannot live there. On the four-measure list, the price is counted as a point in Irvine's favour.
Nothing in Orange County is attainable by the usual standard, which is about four years of income. The range here runs from 7.7 times in Cypress and Aliso Viejo to 17.8 times in Newport Beach and Laguna Beach, and those last two are understated: the census stops recording home values above $2,000,001, so their real multiples are higher than the figure shown.
HOA dues, price, and the thing that actually matters
Agents recommending a city for families usually attach a warning about the HOA dues and the asking price. The worry underneath it is sound, and there is good research behind it. Once a household is spending more than a third of what it earns on housing, the effects show up in the children: lower test scores, more behaviour problems, driven by parental stress and by the money that is no longer there for childcare, food and activities.
So the useful question is not what homes cost. It is how many families in a city have ended up past that one-third line once the mortgage, HOA dues, Mello-Roos and property tax are counted together. The census reports that for every city.
| Typical monthly cost to own | Homeowners past a third of income | |
|---|---|---|
| Rancho Santa Margarita | $3,425 | 3 in 10 |
| Cypress | $3,205 | 3 in 10 |
| Irvine | $3,852 | 3 in 10 |
| Yorba Linda | $3,818 | 4 in 10 |
| Garden Grove | $2,718 | 4 in 10 |
| Newport Beach | $4,001 | 4 in 10 |
| Laguna Beach | $4,001 | 5 in 10 |
Read the two columns against each other and the realtor's warning falls apart. Rancho Santa Margarita carries Mello-Roos assessments and full master-planned HOA dues, and has the fewest stretched households of any city in the county. Garden Grove owners pay about $1,300 a month less than Laguna Beach owners and more of them are struggling, not fewer. Across all thirty cities, what a home costs tells you almost nothing about whether the families in it are stretched.
What decides it is the gap between the carrying cost and what a household earns. So the ranking counts the share of stretched owners, not the sticker price. Whether a city is affordable to you depends on your income, and no ranking can know that.
The four-measure ranking tracks median household income at 0.89, where 1.00 would mean the two orders are identical. Ours tracks it at 0.59. Both lists lean heavily on income.
The pattern is in the county, not in the scoring. Eleven of the eighteen measures correlate positively with income, and for nine of them the relationship is statistically solid.
| Correlation with household income | |
|---|---|
| Low violent crime | +0.80 |
| Clean air | +0.74 |
| Tree canopy | +0.74 |
| Childcare slots per child | +0.71 |
| Test scores | +0.68 |
| Economic mobility | +0.62 |
| Park acres per resident | +0.54 |
| Away from traffic | +0.45 |
| Homes with 3+ bedrooms | +0.41 |
| Crime falling | +0.09, not significant |
| Short commutes | +0.06, not significant |
| Somewhere to walk to | -0.23, not significant |
| Other families nearby | -0.27, not significant |
| Connected streets | -0.32, not significant |
| Building its housing | -0.03, not significant |
| A family can afford to move in | -0.78 |
| Walking distance to school | -0.65 |
Licensed childcare, clean air, tree cover and low reported crime are not evenly distributed, and they cluster in the same places. A city with a larger tax base runs more park acreage, plants and maintains more street trees, and staffs a police department differently. Stanton has 0.7 acres of park per 1,000 residents and a median household income of $81,455. Fountain Valley has 14.0 and $111,797. Most of it is bought, collectively, over decades.
The places that break the pattern are the useful ones. Tustin reaches tenth on the lowest median income in the top ten, on short commutes and school coverage. Cypress reaches eighth below every city above it but one. Fountain Valley clears the national park benchmark on an income $40,000 below Yorba Linda's.
And the two things money does not buy here are both about a child moving around on their own. Walking distance to school runs against income at -0.65: the two shortest walks in Orange County are in Santa Ana and Garden Grove, its two poorest large cities, where 91% and 92% of homes are within ten minutes of a campus. The longest is Laguna Beach, where 9% are. Street connectivity runs the same way. Santa Ana and Garden Grove were laid out before the freeways, on small blocks, and the schools sit inside the neighbourhoods.
How the list was built
Two of the four local measures stay: test scores and violent crime, at lower weight. House age and home value are out, because neither says anything about a child's day. The additions are childcare places per child under six, walking distance to school, street connectivity, everyday destinations near homes, park acres per resident, tree canopy, traffic and diesel exposure, what children raised in each city went on to earn, the price of getting in, and three stand-ins for things nobody counts.
Each measurement becomes a value between 0 and 1 through a curve chosen to match how the thing is actually experienced. Distance to school is the clearest case: going from 300 feet to 1,000 feet changes whether a child walks, going from 6,200 to 6,900 changes nothing, because nobody is walking either way. Each value is then multiplied by its weight, and the weighted values are summed.
The eighteen curves
Each panel turns one measurement, in its own units along the bottom, into a value from 0 to 1. Every dot is one Orange County city.
What is not in this, and why
Every measure here leaves a public record. Most of what families mean by a good place for children does not: whether neighbours know each other, whether somewhere feels safe as opposed to testing safe, how a new family makes friends, whether a ten-year-old can be sent to the shop alone. Three of the eighteen measures are rough stand-ins for that and are the weakest things on the list.
Other measures would improve the ranking and are not available. Some are published only at county level, which inside Orange County means one number for all thirty cities. Some record an administrative convention rather than the thing itself. Some exist but only where a volunteer happened to map them. And every measure that survived was tested against health and time outcomes across 602 census tracts with income removed; two failed and were dropped rather than kept because they sounded right.
One limitation affects figures on this page directly. Every distance here is a straight line. A ten-minute walk that crosses an eight-lane arterial is not a ten-minute walk, and the research on children getting around alone says the crossings matter as much as the distance. Measuring that needs a routable street network we have not built, so the walking numbers are optimistic, and most optimistic in the cities built around wide roads.
Several well-known communities are missing entirely: North Tustin, Ladera Ranch, Coto de Caza, Rossmoor. They are unincorporated, so they have no police department of their own, their schools are filed by the state under a neighbouring postal city, and licensed childcare is recorded the same way. We cannot score them without guessing, and being left off is not a judgement about them.
Compare the cities you are considering
Pick up to three. Every bar is that city's value on the 0 to 100 scale for that measure. Cost sits below the line, outside the score. This also runs as a standalone tool at saktoo.com/tools/oc-family-compare.
Your weights, not ours
A family with a toddler and a family with a teenager are not shopping for the same city. The quiz scores neighbourhoods on the weights you set.
Sources
Cities are US Census places (TIGER/Line 2023) in Orange County, incorporated only, with at least 20,000 residents. Childcare is the California Department of Social Services licensed child care center directory. Schools are the California Department of Education public school directory; test scores are CAASPP Smarter Balanced 2025. Crime, both level and direction, is California DOJ OpenJustice. Parks are OpenStreetMap polygons, excluding nature reserves. Households with children, commute times, income, housing and tenure are the American Community Survey five-year estimates for 2023. Economic mobility is Opportunity Atlas. Air quality and canopy come from our own neighbourhood data. Health outcomes used for validation are CDC PLACES 2023. The park benchmark of 10 acres per 1,000 residents is the median of over 1,000 US agencies in the NRPA 2026 Agency Performance Review.
Distances are averaged over 2020 Census blocks weighted by housing units, which is what makes them describe the walk from homes rather than from open land. Race, ethnicity and household income are not inputs to the ranking.
The four-measure comparison ranking is our reconstruction of what local Orange County family listicles rank on. Its weights are our estimate rather than a published standard. It is here for comparison only.
Sean Hingco, Founder, Saktoo
Sean Hingco built and maintains Saktoo, which scores 7,644 neighborhoods across Los Angeles and Orange County on census, school, crime and environmental data. He writes the methodology behind every ranking here and publishes the underlying figures so they can be checked.
More about the person behind Saktoo →