Should You Rent in LA or Orange County? The Differences That Actually Decide It
By Sean Hingco, Founder, Saktoo
Rent caps, rail lines, street grids, and who writes the rules: a data-backed comparison of renting on each side of the county line, with no forced verdict.
Ask where you should rent, Los Angeles or Orange County, and you'll get the cliché within a sentence: LA is for young people who like chaos, OC is for families who like cul-de-sacs. That framing is popular because it's easy, and it's mostly useless, because it describes vibes rather than the things that actually change your month-to-month life as a renter.
The more useful observation is structural. These two counties were built by different processes. One accreted parcel by parcel over 140 years; the other filled its flatlands with tract suburbs in a single explosive generation, then handed its remaining ranch land to a few companies to design from scratch. They are also governed by different rules that renters feel directly: how much your rent can legally rise, whether you can live without a car, and who decides both. This article walks through four structural differences and one important set of similarities, with real numbers throughout. What it deliberately doesn't do is declare a winner, because there isn't one. There's only a fit, and fit depends on your priorities.
| Los Angeles County | Orange County | |
|---|---|---|
| How it grew | Organic, parcel by parcel | Tract boom, then planned |
| Urban rail | 6 lines · 125 miles | None until 2027 |
| Rent stabilization | 624k units at 1–4%/yr | 1 city; elsewhere 8.7% |
| Local government | 88 cities + county areas | 34 cities, no dominant one |
| Earthquake & fire | Yes | Also yes |
How each place got built
Los Angeles urbanized the way most American cities did, only faster and looser: streetcar suburbs in the 1880s, oil and citrus money subdividing ranch land, developers gridding out tracts one at a time with little coordination between them. The result is a county where the street network changes personality every few miles, from a dense commercial grid in Koreatown to hillside cul-de-sacs in Encino to industrial blocks bleeding into bungalow courts near Vernon. Nobody planned Los Angeles County as a whole; it's an accumulation of tens of thousands of separate decisions.
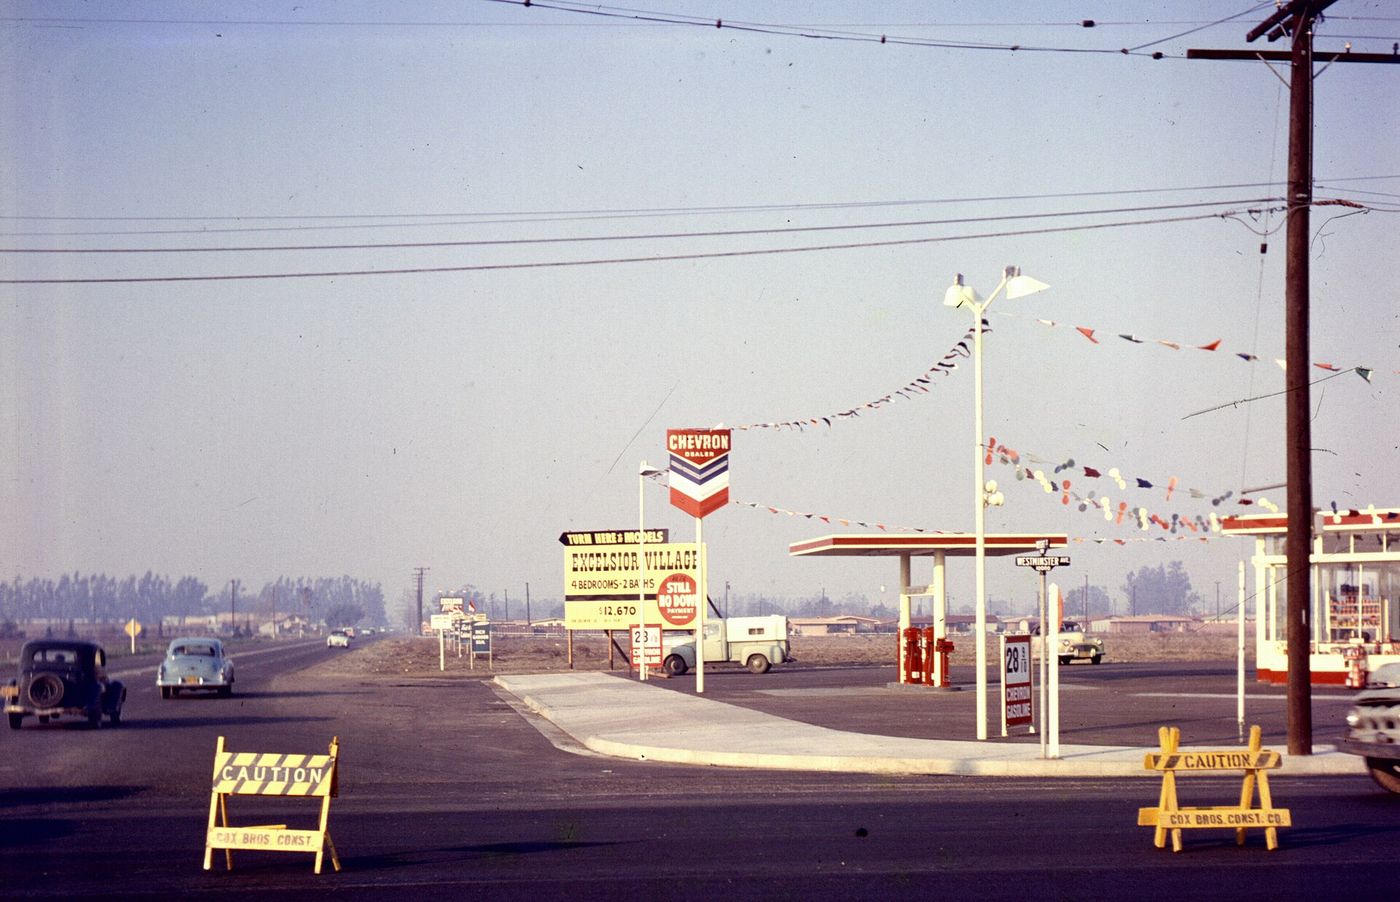
Orange County compressed that same journey into a single generation, and it happened in two distinct waves. The first looked like Los Angeles on fast-forward: Disneyland opened in Anaheim in 1955, aerospace plants spread south, and the county's population more than tripled in a decade, from 216,000 in 1950 to 704,000 in 1960, passing 1.4 million by 1970. The northern flatlands (Anaheim, Garden Grove, Westminster, Santa Ana) filled with conventional tract housing on the old citrus road grid, and ten cities incorporated between 1953 and 1962 just to keep up. Hold onto that first wave; it explains a data point coming shortly.
The second wave is the one that makes OC structurally unusual. The county's remaining land wasn't subdivided farm by farm the way LA's was; it sat in a handful of vast ranch holdings, and their owners became city-builders. The largest was the Irvine Ranch: 93,000 acres, roughly a fifth of the county, held by one company. In 1960, architect William Pereira completed a master plan for a university city on that land (the Irvine Company sold UC the first 1,000 acres for a dollar). The O'Neill family's Mission Viejo Company did the same on the old Rancho Mission Viejo starting in 1963, producing Mission Viejo, Rancho Santa Margarita, and Ladera Ranch. Scholars have a name for what resulted: the academic study Postsuburban California treats Orange County as the archetype of a new settlement form: not a city, not a suburb of one, but a decentralized lattice of privately master-planned communities.
acres
93,000
The Irvine Ranch: about one-fifth of Orange County, master-planned by a single company starting in 1960.
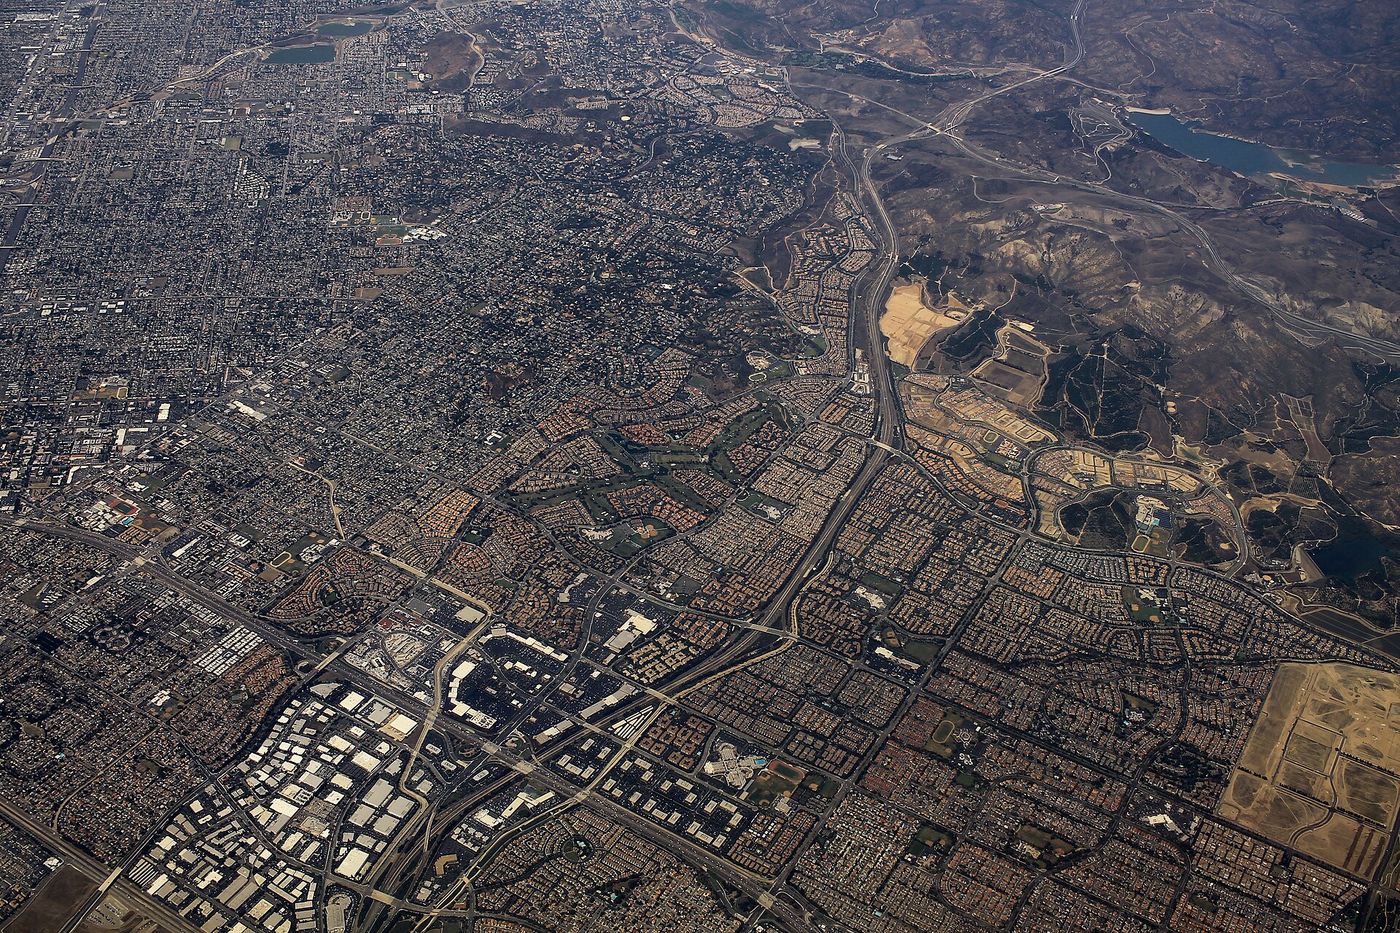
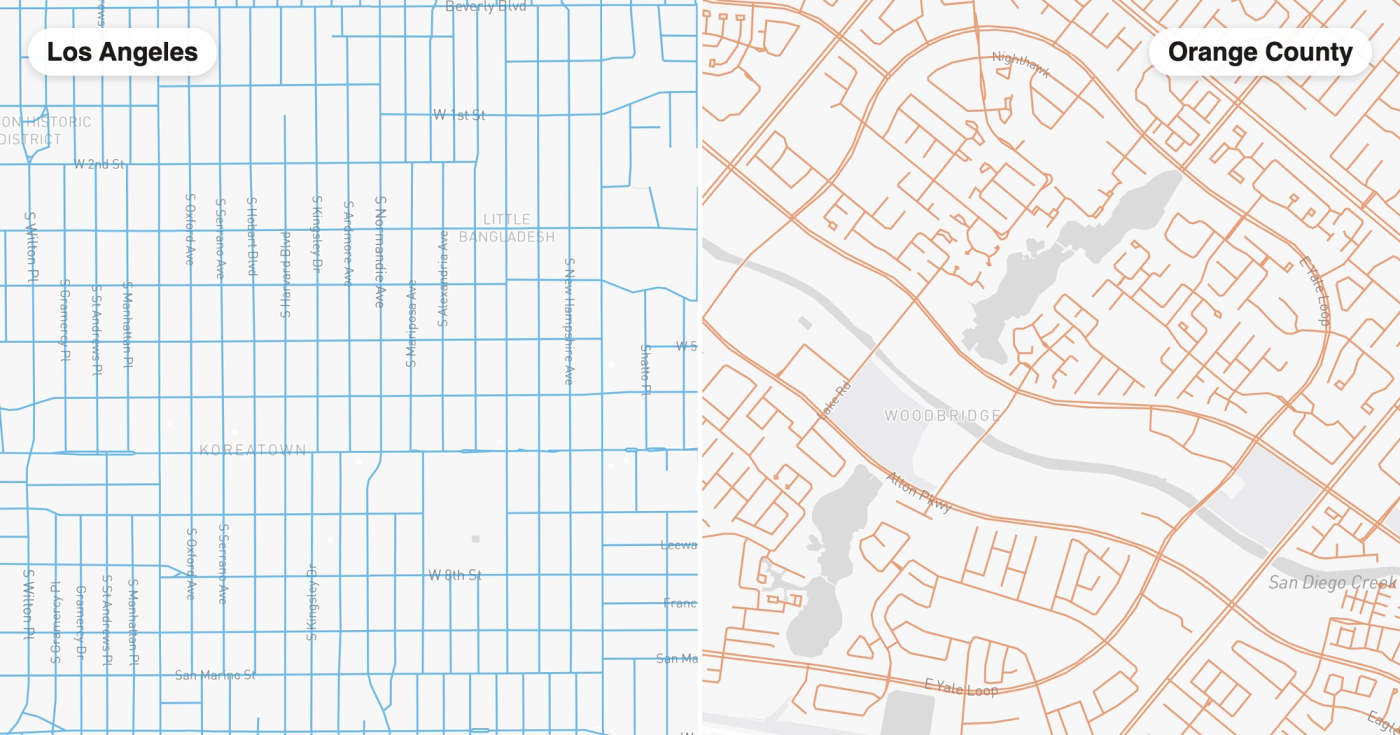
You can see the difference from the air, or from two map tiles at the same zoom. LA's Koreatown is a tight rectilinear grid where every block connects to every other block. Irvine's Woodbridge is loops and lakes: calmer, greener, and built so that most streets deliberately don't connect, which is pleasant to live on and hard to walk out of.
Koreatown, Los Angeles
Walk index 15.5 · 26 transit arrivals/hr
Woodbridge, Irvine
Walk index 13.4 · 2 transit arrivals/hr
Here's the nuance the aerial cliché misses, and it comes straight out of our database: on average, the two counties are nearly identical. Across 6,425 LA County block groups, the mean EPA walkability index is 13.6; across 1,823 Orange County block groups, it's 13.2. The difference lives in the extremes. LA's top neighborhoods (Downtown at 17.3, Venice at 17.0, Koreatown at 15.5) have no OC equivalent. But remember OC's first wave: the flatland cities built in the 1950s tract boom walk like LA neighborhoods, because structurally they are LA neighborhoods. Little Saigon and central Westminster both score 15.2, essentially tied with Silver Lake, and the resemblance runs deeper than one score. On the EPA's land-use mix measure, which rates how evenly homes, jobs, and shops share the same blocks, Little Saigon (0.63) sits right with Silver Lake (0.65) and Koreatown (0.65), while the master-planned communities cluster apart at 0.57 to 0.58, their uses deliberately separated. Same bones, same mixing of daily life. The real divide isn't the county line. It's the wave line: OC's second-wave, master-planned half (Woodbridge at 13.4, Mission Viejo around 12.6, Ladera Ranch at 9.1) was designed around the car, and design is destiny for walkability.
The tour below runs that continuum in order. Five stops, each one younger, further south, and lower on the EPA walk index than the last, from the 1880s core to a cul-de-sac community whose first residents arrived in 1999. Watch the tracker in the corner count down as a century of Southern California development plays out north to south.
One descending line: newer, further south, more car-dependent. The outlined boundary is the place named in the badge; lit streets show its network pattern, dots mark real amenities, Downtown's colored lines are Metro's six rail lines, and the corner tracker shows the EPA walk index falling. Data: EPA Smart Location Database and LA Metro, aggregated by Saktoo.
| Built | Walk index | Land-use mix | Transit/hr | |
|---|---|---|---|---|
| Downtown LA | 1880s on | 17.3 | 0.64 | 141 |
| Koreatown | 1900s–20s | 15.5 | 0.65 | 26 |
| Little Saigon | 1950s–60s | 15.2 | 0.63 | 6 |
| Woodbridge | 1976 | 13.4 | 0.58 | 2 |
| Ladera Ranch | 1999 | 9.1 | 0.57 | None |
One more thing the built form determines: where the jobs are. LA is polycentric, spread across Downtown, the Westside's tech and media cluster, Hollywood, the ports, and South Bay aerospace, with entertainment alone supporting over 300,000 workers. OC's employment concentrates where the plans put it: the Irvine Spectrum tech and biotech corridor (400+ companies), Anaheim's tourism economy anchored by OC's largest employer in Disneyland, and county government in Santa Ana. Neither is 'better'; they're differently shaped, and the shape decides which commutes are plausible.
Getting around without a car
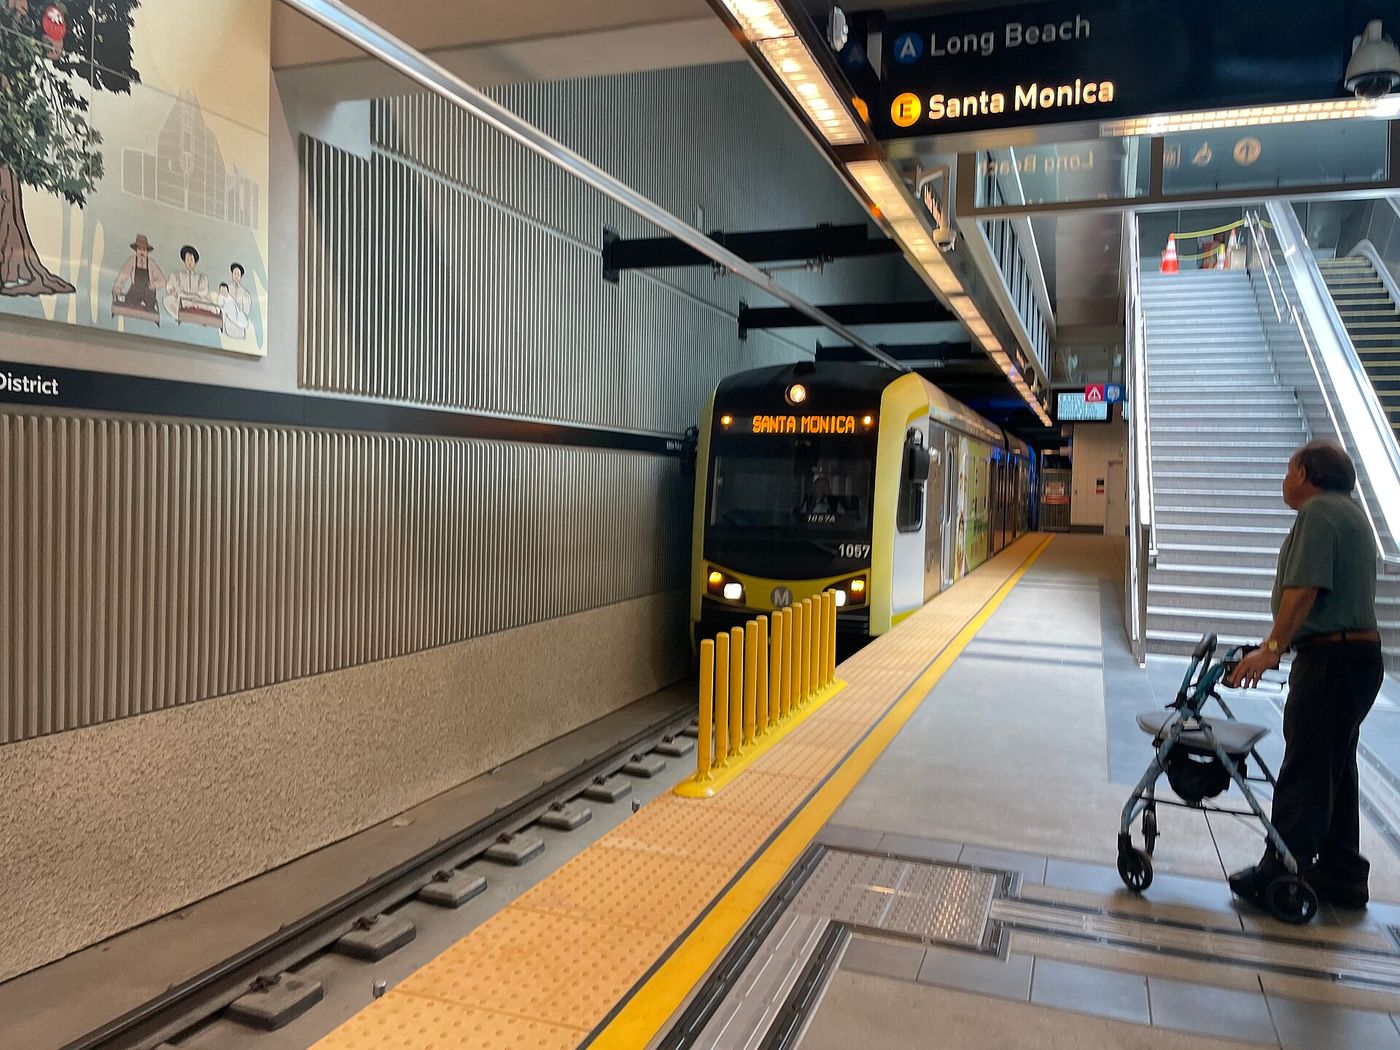
The starkest structural gap is rail. As of mid-2026, LA Metro operates six rail lines covering 125.1 miles and 110 stations, and it's still growing: the D Line subway extension opened three new Wilshire stations in May 2026, and the A Line's Foothill extension adds 12.3 more miles in September. Orange County operates zero miles of urban rail. Its Metrolink commuter service runs on freight-era schedules aimed at peak-hour commuters, and its first modern rail project, the 4.15-mile OC Streetcar between Santa Ana and Garden Grove, began street testing in early 2026 with revenue service now expected in March 2027, six years behind its original date.
rail miles
125 vs 4
LA Metro's operating rail network vs. the OC Streetcar, which is Orange County's entire urban rail program and opens in 2027.
This wasn't inevitable; OC almost built a real network. The CenterLine light rail plan started in 1992 as a 90-mile system, shrank to 32 miles by 2001 under city-by-city opposition, shrank again to 9.3 miles, and was cancelled outright in 2005. That was the fragmented governance you'll read about two sections down, deciding transit policy by attrition. The money went to buses and Metrolink instead.
But here's what the rail-mileage comparison hides, and what our block-group data shows: basic transit coverage is nearly identical. Some fixed-route service reaches 85.5% of LA County block groups and 86.7% of OC's. The real difference is frequency: how long you stand at the stop. The median LA County block group sees 6.7 transit arrivals per hour within a quarter mile; the median OC block group sees 3.3. At the top end the gap explodes: Downtown LA's median block group gets 141 arrivals an hour, Woodbridge gets 2. Renters have noticed. About 298,000 LA County households live without a car. In Orange County, it's about 45,000.
The tradeoff statement, not the verdict: a car-free or one-car-household life is genuinely viable in a specific set of LA neighborhoods, and genuinely difficult almost everywhere in OC. Meanwhile, an OC renter who drives everywhere anyway gives up little and gains the master plan's shorter local errands and calmer streets. Which side of that trade matters is a fact about you, not about the counties.
What happens when your rent goes up
This is the difference most renters don't discover until the renewal notice arrives, and no listing site surfaces it: the two counties operate under meaningfully different rent-increase rules, and the gap compounds every year you stay.
In the City of Los Angeles, the Rent Stabilization Ordinance covers roughly 624,000 units across 118,000 properties, generally buildings with two or more units first occupied on or before October 1, 1978. The current allowable increase is 3%, and a 2026 reform tightened the formula to 90% of inflation with a hard band of 1% to 4%, while eliminating the old utility surcharges. Newer LA City buildings aren't rent-capped locally, but most gained just-cause eviction protection under the city's 2023 Just Cause Ordinance, and unincorporated LA County has its own stabilization ordinance.
rent-stabilized units
624,000
Units covered by LA City's RSO. That is more rental housing than most American cities contain in total; Orange County's equivalent program covers one city.
In Orange County, exactly one of 34 cities has local rent stabilization: Santa Ana, which caps increases on pre-1995 buildings at the lower of 3% or 80% of inflation, currently 2.87%. Everywhere else in the county, the only ceiling is California's statewide AB 1482: 5% plus inflation, capped at 10%, which currently works out to 8.7% for the LA–OC region. AB 1482 is real protection: it exists, it has just-cause rules, and it covers most buildings older than 15 years. But an 8.7% ceiling and a 3% ceiling are different financial instruments. Here's what that difference does to the same unit over five years.
The same lease, five years later
Slide to your rent. Each line is the most a landlord can legally charge.
The 5-year gap
$0
Extra rent the typical OC rental could legally collect over 5 years, compared with the rent-stabilized LA unit.
Three honest caveats. First, these lines are legal maximums, not forecasts; plenty of landlords in both counties raise rent by less. Second, the caps move: 8.7% is this year's AB 1482 number, not a constant. Third, coverage is about building age, not county lines. A 2020-built apartment in Koreatown has no local cap either, and a 1970s building in Santa Ana is protected. The structural difference is the odds: in the City of LA, hundreds of thousands of older units carry a hard 1–4% band, and even uncovered units get just-cause protection. In 33 of OC's 34 cities, the strongest available protection is the state's 8.7%. If you plan to stay put for years, that's one of the highest-magnitude differences on this list, and the least talked about.
Who's actually in charge where you live
Why does one county have 624,000 stabilized units and the other has one city's worth? Structure, again. LA County contains 88 cities plus about a million people in unincorporated territory governed directly by the county Board of Supervisors, and it's dominated by a single giant: the City of Los Angeles, home to nearly 4 million people. When that one city council passes a tenant ordinance, it instantly covers more renters than every Orange County city combined.
Orange County is the opposite shape: 34 cities of small-to-medium size, nearly complete incorporation, and no dominant center. Several of its cities were literally built by their developer before they were governments. Irvine incorporated in 1971, a decade after its master plan was drawn, and Aliso Viejo, planned by a land company starting in 1976, didn't become a city until 2001. Political scientists call this fragmentation; renters experience it as variance. Your protections, your permitting climate, and your development pipeline are decided by whichever small council governs your address. That's how OC can contain both Santa Ana's 2.87% rent cap and, one city line away, no local protection at all. It's also how a 90-mile rail plan got whittled to zero: regional projects in OC need dozens of yeses, and any city can be a no.
This section is shorter than the others because it's the least directly actionable: you can't vote in a city you don't live in yet. But it's the explanation underneath everything else in this article. LA's differences from OC aren't personality, they're institutional design.
Where they're actually the same
Everything above might read like the counties are different planets. They're not, and the standard cliché of chaotic city vs. placid suburb gets several important things wrong in both directions.
They share their disasters. The Newport–Inglewood fault runs 47 miles from Culver City through Long Beach to Newport Beach. One fault, both counties, and the source of the 1933 Long Beach earthquake. Seismologists consider a large rupture on it potentially more damaging than a San Andreas event, simply because it runs under the urban core. Fire risk crosses the county line just as freely: CAL FIRE's hazard maps paint Anaheim Hills, Modjeska Canyon, and inland south OC in the same very-high-severity zones as LA's hillside neighborhoods, and Anaheim's mapped hazard area actually grew in the 2025 update. Renting in either county means the same questions about building age, retrofit status, and what your renter's insurance actually covers.
They share the freeway as a baseline condition. In our CalEnviroScreen data, the average OC block group sits at the 63rd percentile statewide for traffic density; the average LA block group sits at the 61st. The 405 does not respect the county line, and neither does the air near it.
And they share something the suburb stereotype erases entirely: both counties are anchored by nationally significant immigrant communities. Little Saigon in Westminster and Garden Grove is the largest Vietnamese community outside Vietnam, with roughly 242,000 Vietnamese residents counted in Orange County in the 2020 census. It plays the same anchor role Koreatown plays in LA, in a metro area with the largest Korean population in the country. These aren't parallel curiosities; they're parallel structures, and they even walk alike.
walk index
15.2 ≈ 15.1
Little Saigon vs. Silver Lake. OC's pre-master-plan neighborhoods are structurally LA neighborhoods. The stereotype just never checked.
The question this article can't answer
Notice what didn't appear anywhere above: a winner. That's not diplomacy; it's the honest reading of the data. Rent protection is stronger in LA; a new-construction unit is uncapped in both. Car-free life is viable in parts of LA and impractical in most of OC; a two-car household barely notices. The master plan costs you walkability and buys you parks, quieter streets, and shorter errands. Every one of these is a tradeoff whose weight depends on your income, your commute, your household, and how long you plan to stay. In other words, it depends on inputs this article doesn't have.
The quiz does have them. It scores real listings across both counties on affordability against your actual budget, commute time to your actual workplace, walkability, environment, and space: the same dimensions this article just walked through, weighted by what you tell it matters. If you've read this far and you're leaning one direction, we've also gone deeper on both: our data-driven guide to Irvine's villages for the OC-curious, and what rent in LA actually costs for the LA side.
How we researched this
Walkability, transit frequency, and car-ownership figures come from the EPA Smart Location Database (2021 release; 8,248 LA and OC census block groups) and CalEnviroScreen 4.0, aggregated in Saktoo's own database, the same data our quiz scores against. Map dots are OpenStreetMap places; rail lines come from LA Metro's own GTFS feed. Neighborhood figures are block-group averages; transit frequency is median scheduled arrivals within a quarter mile. Policy and history facts were verified against primary sources in July 2026, including the LA Housing Department (RSO coverage and caps), the City of Santa Ana (rent stabilization), the California Apartment Association (AB 1482 caps), LA Metro, OCTA and the OC grand jury's CenterLine report, the City of Irvine and Irvine Historical Society, LA County Planning, Caltech's Southern California Earthquake Data Center, and CAL FIRE hazard-zone maps. Rent-cap figures change annually; if you're reading this after mid-2027, check the linked sources for current numbers.
Sean Hingco, Founder, Saktoo
Sean Hingco built and maintains Saktoo, which scores 7,644 neighborhoods across Los Angeles and Orange County on census, school, crime and environmental data. He writes the methodology behind every ranking here and publishes the underlying figures so they can be checked.
More about the person behind Saktoo →